Static snapshot · $9
Home Energy Analyzer
Your bills already contain a measurement of your building. This gets it out of them — no utility login, no scraping, no API.
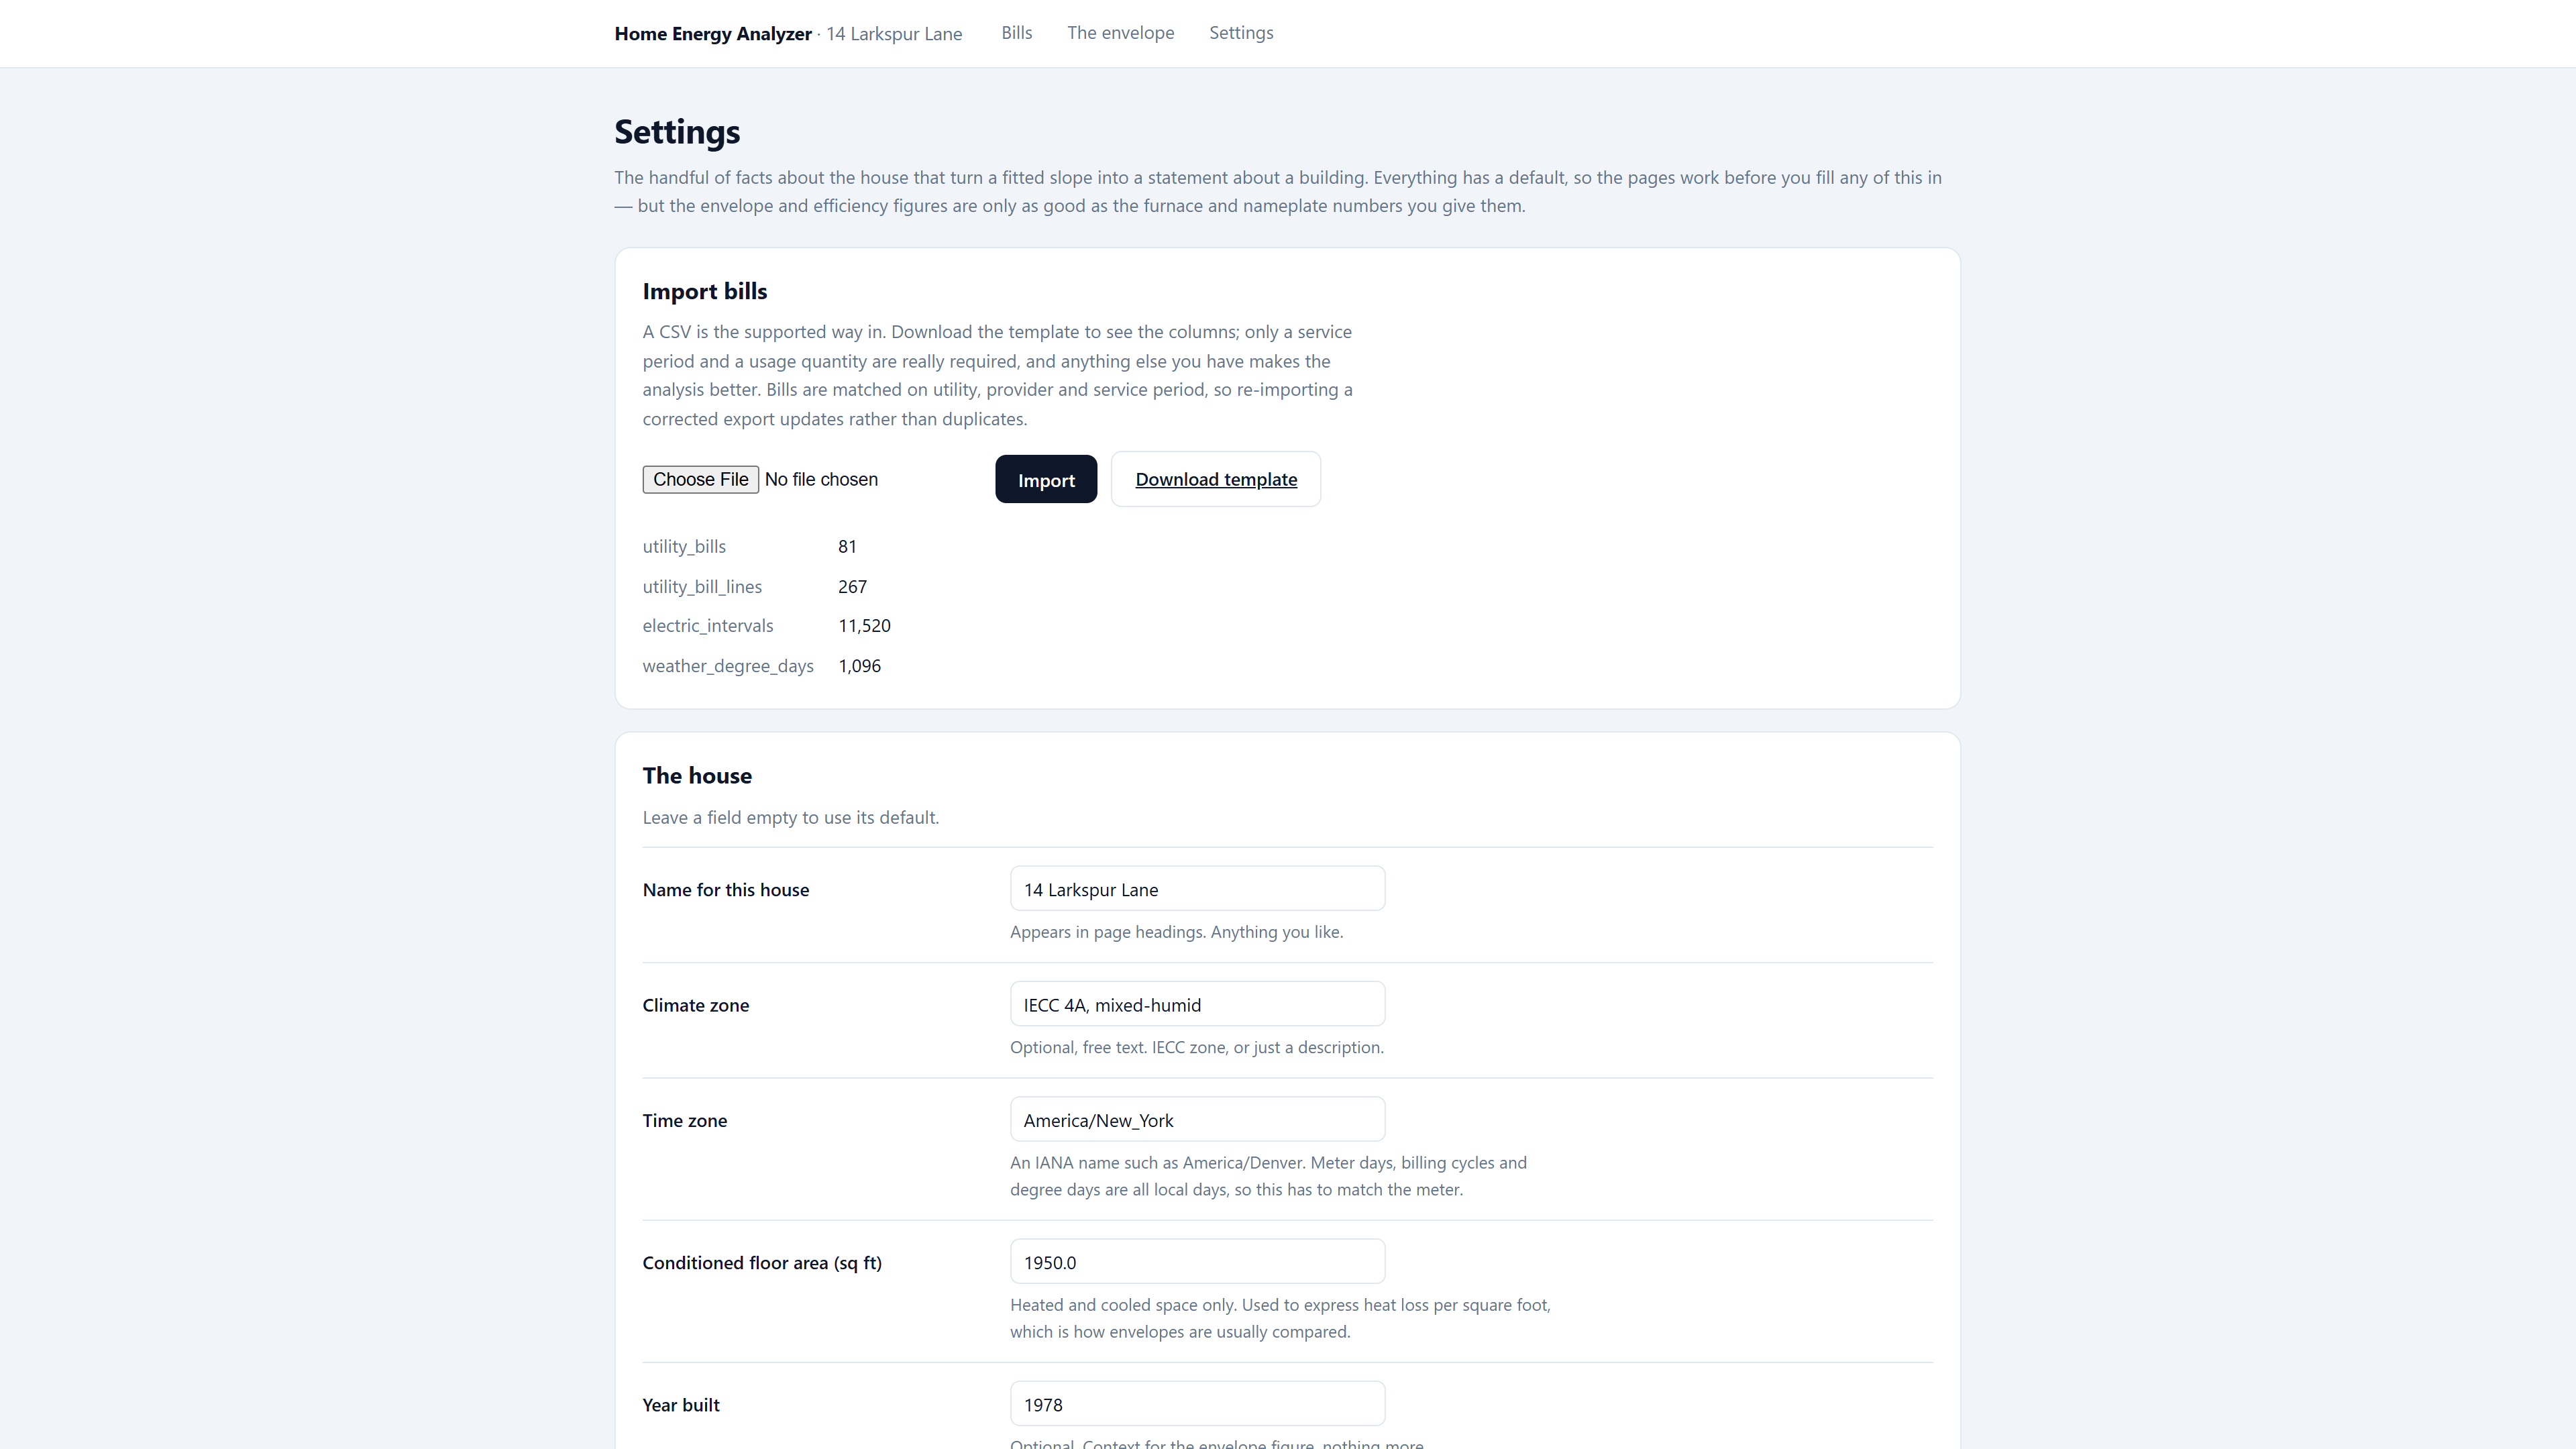
Every shot uses the included synthetic demo house — 14 Larkspur Lane, Fairhaven, fictional, IECC zone 4A. No real bills, addresses or account numbers appear in any image. Captured from the packaged build.
What it looks like
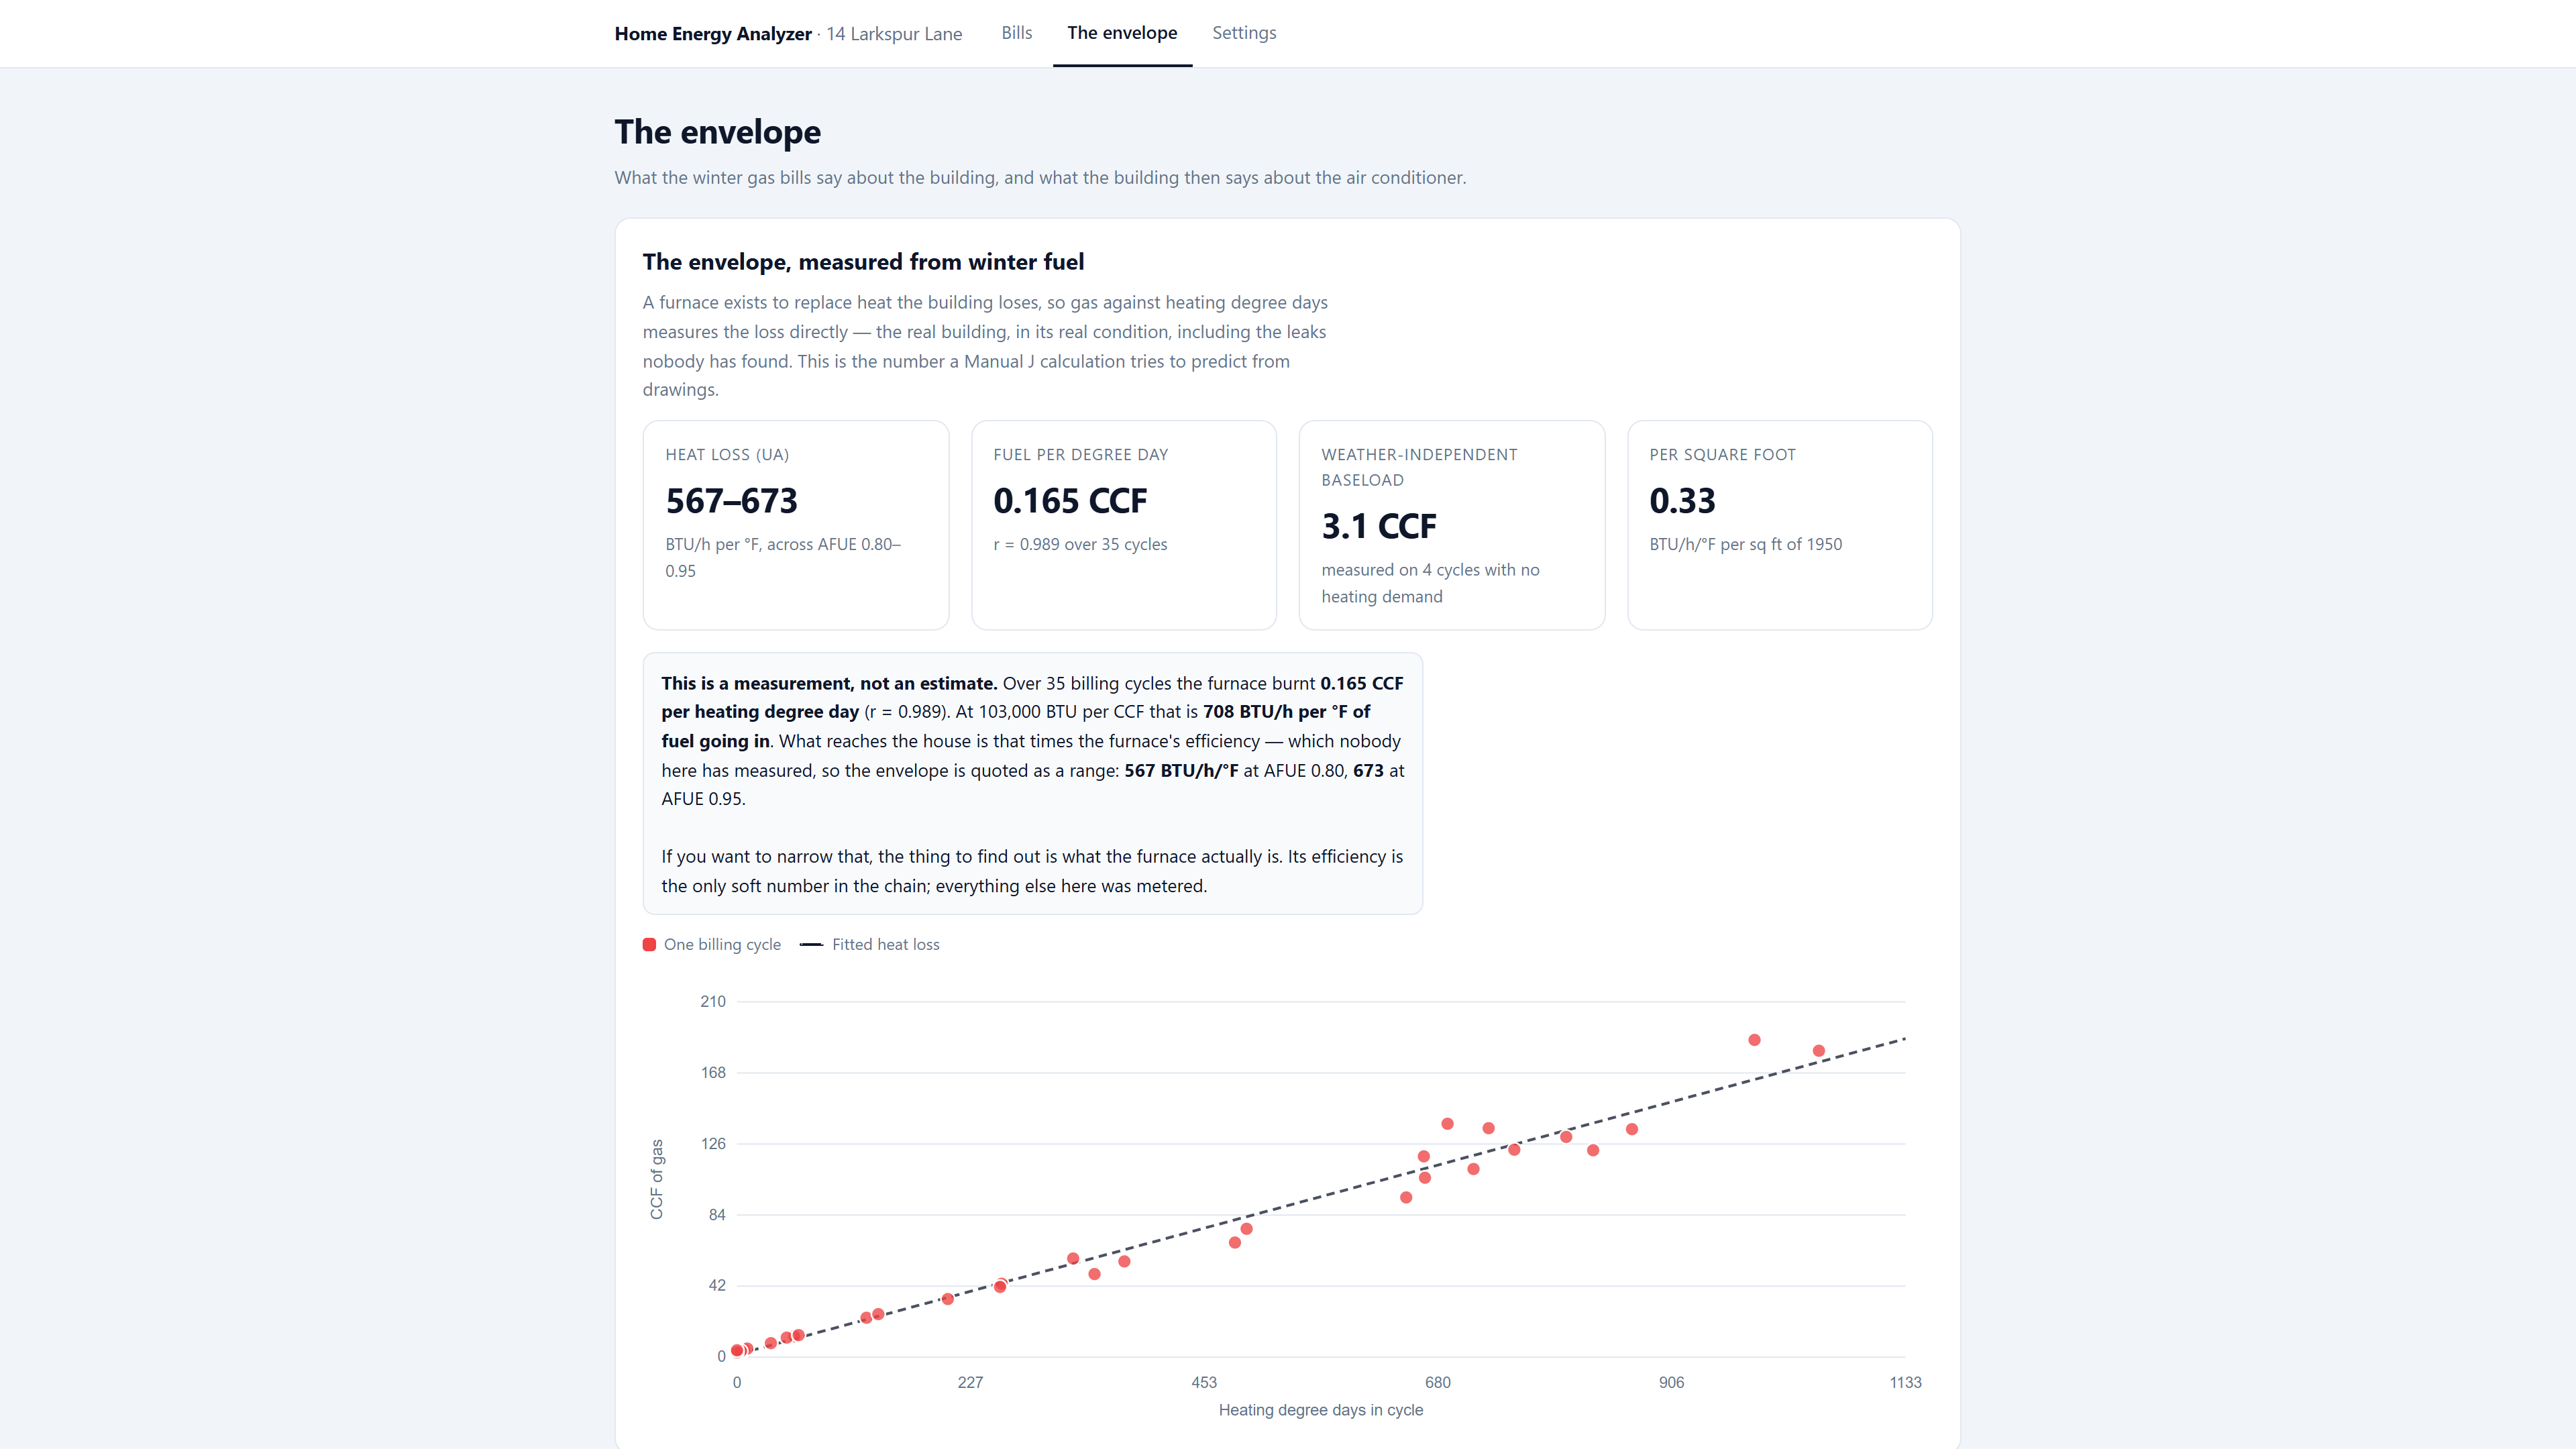
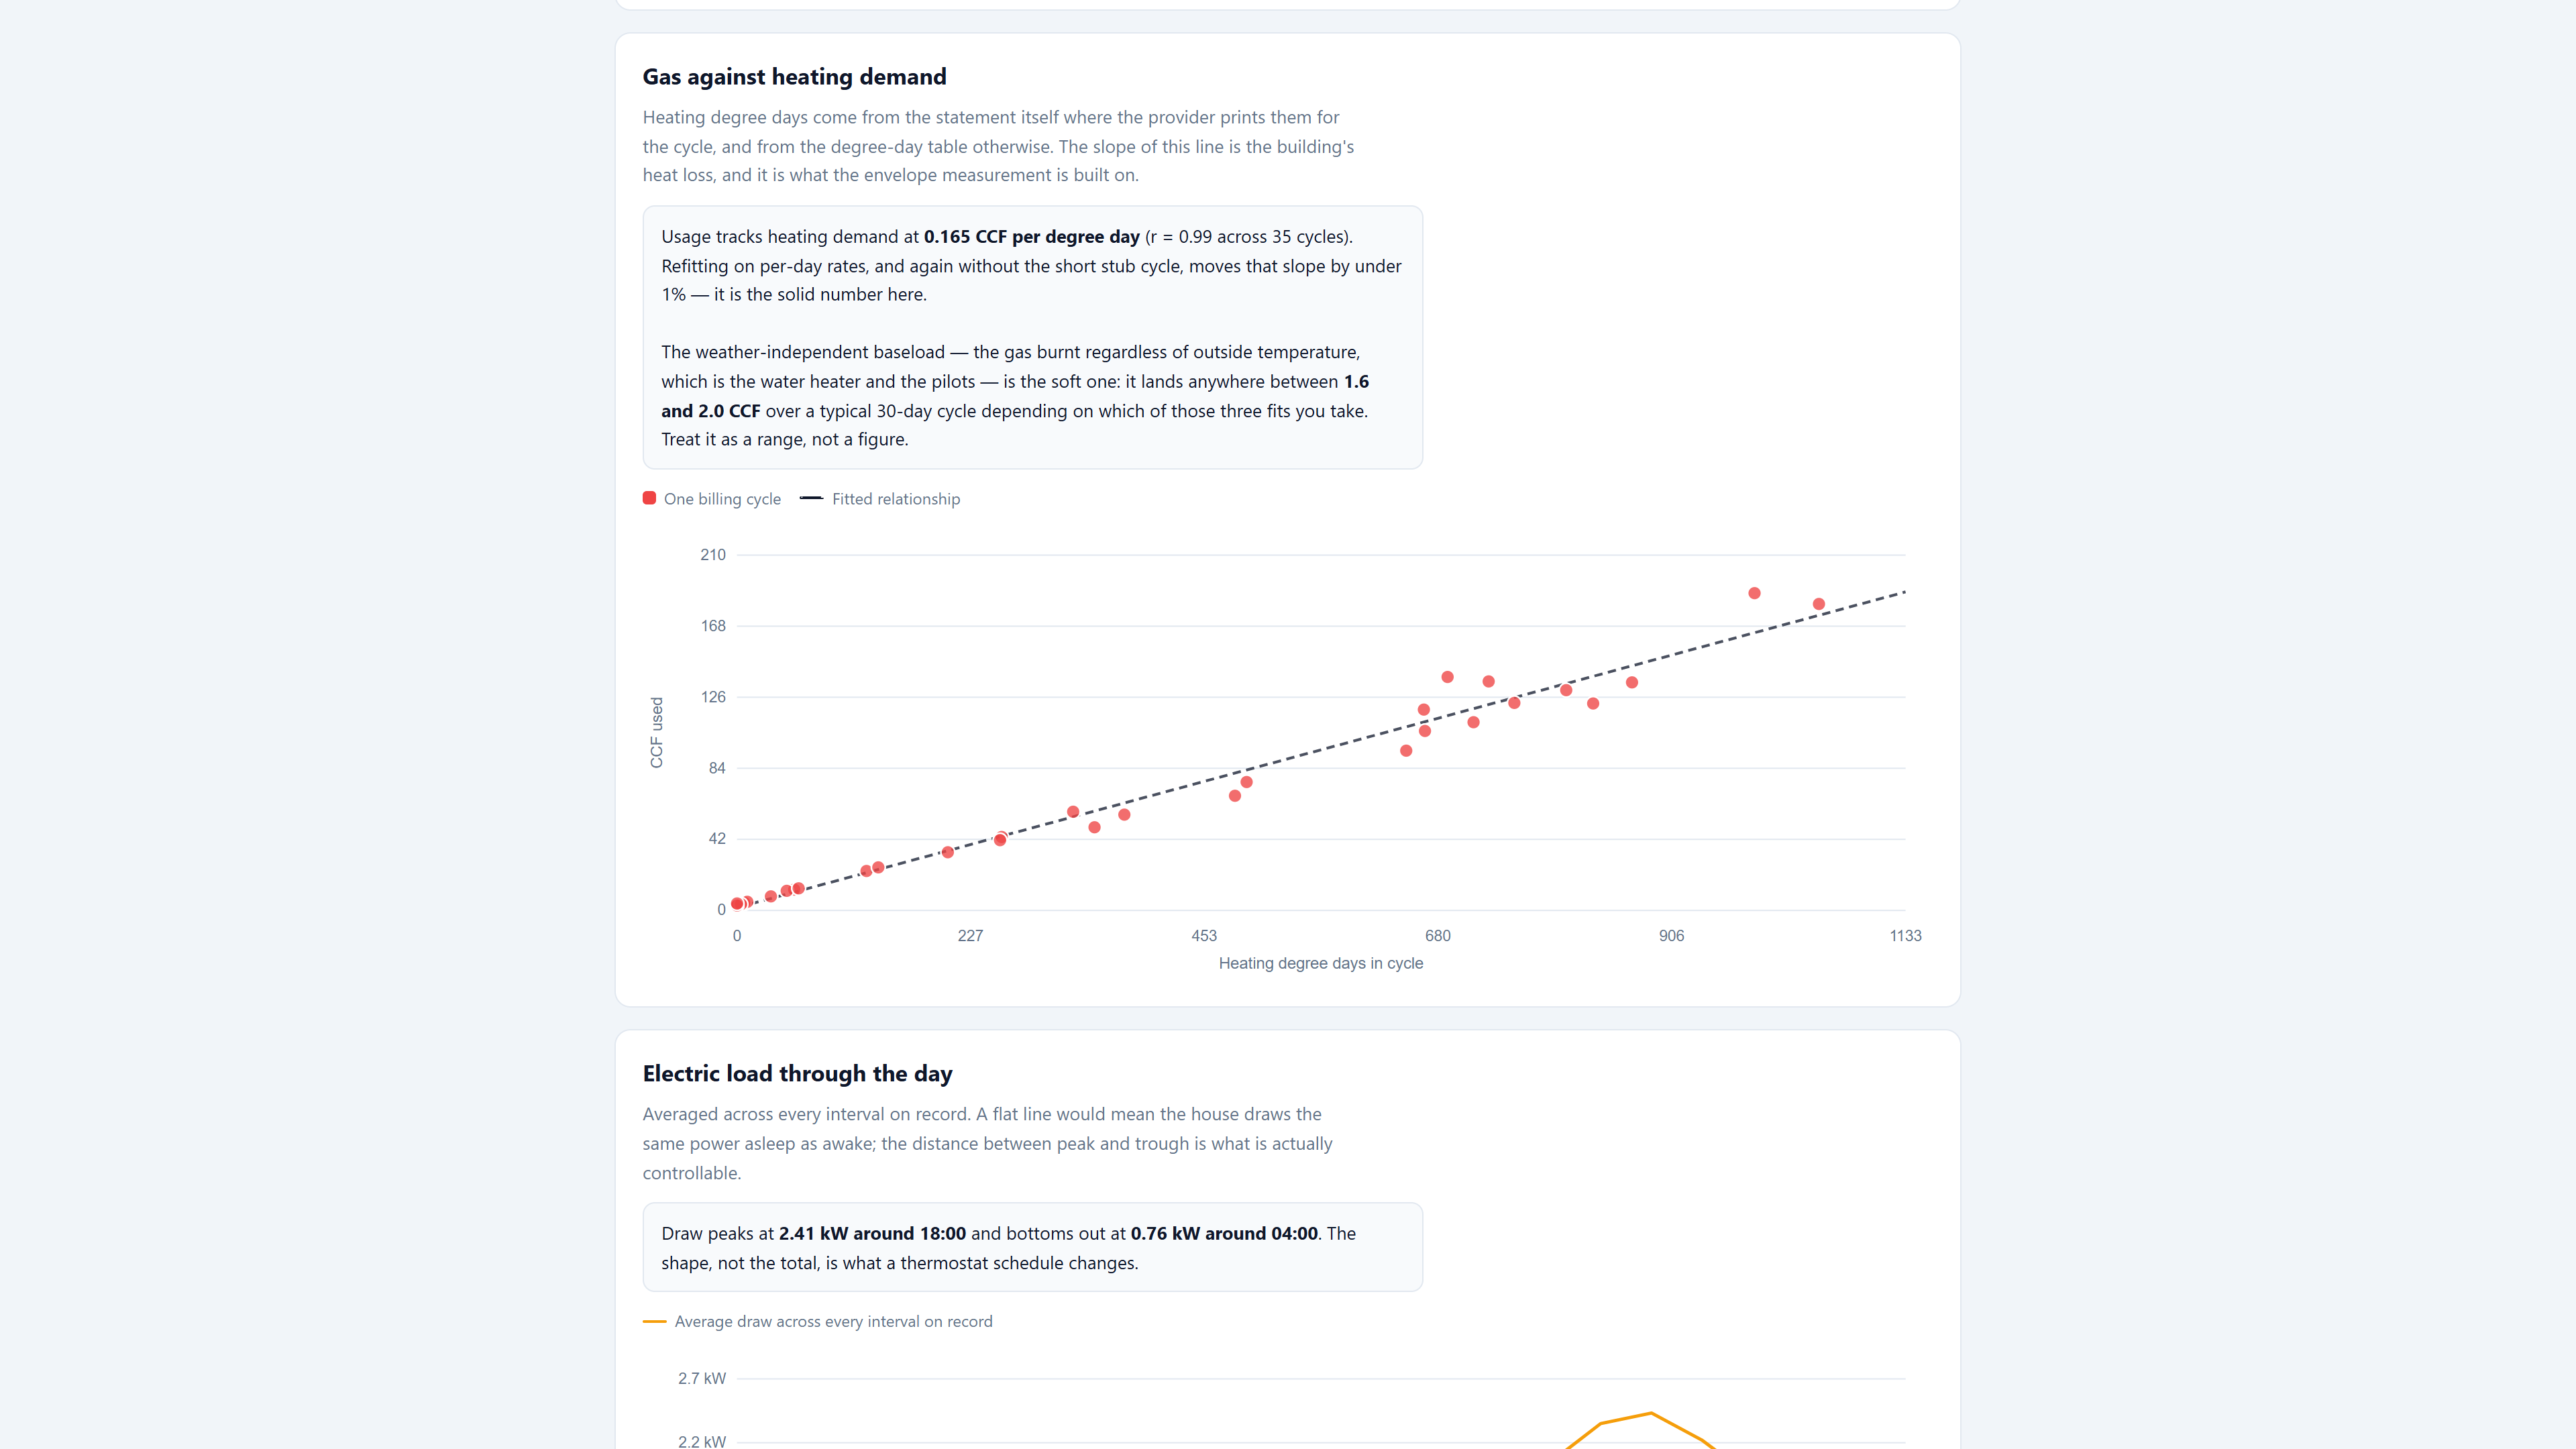
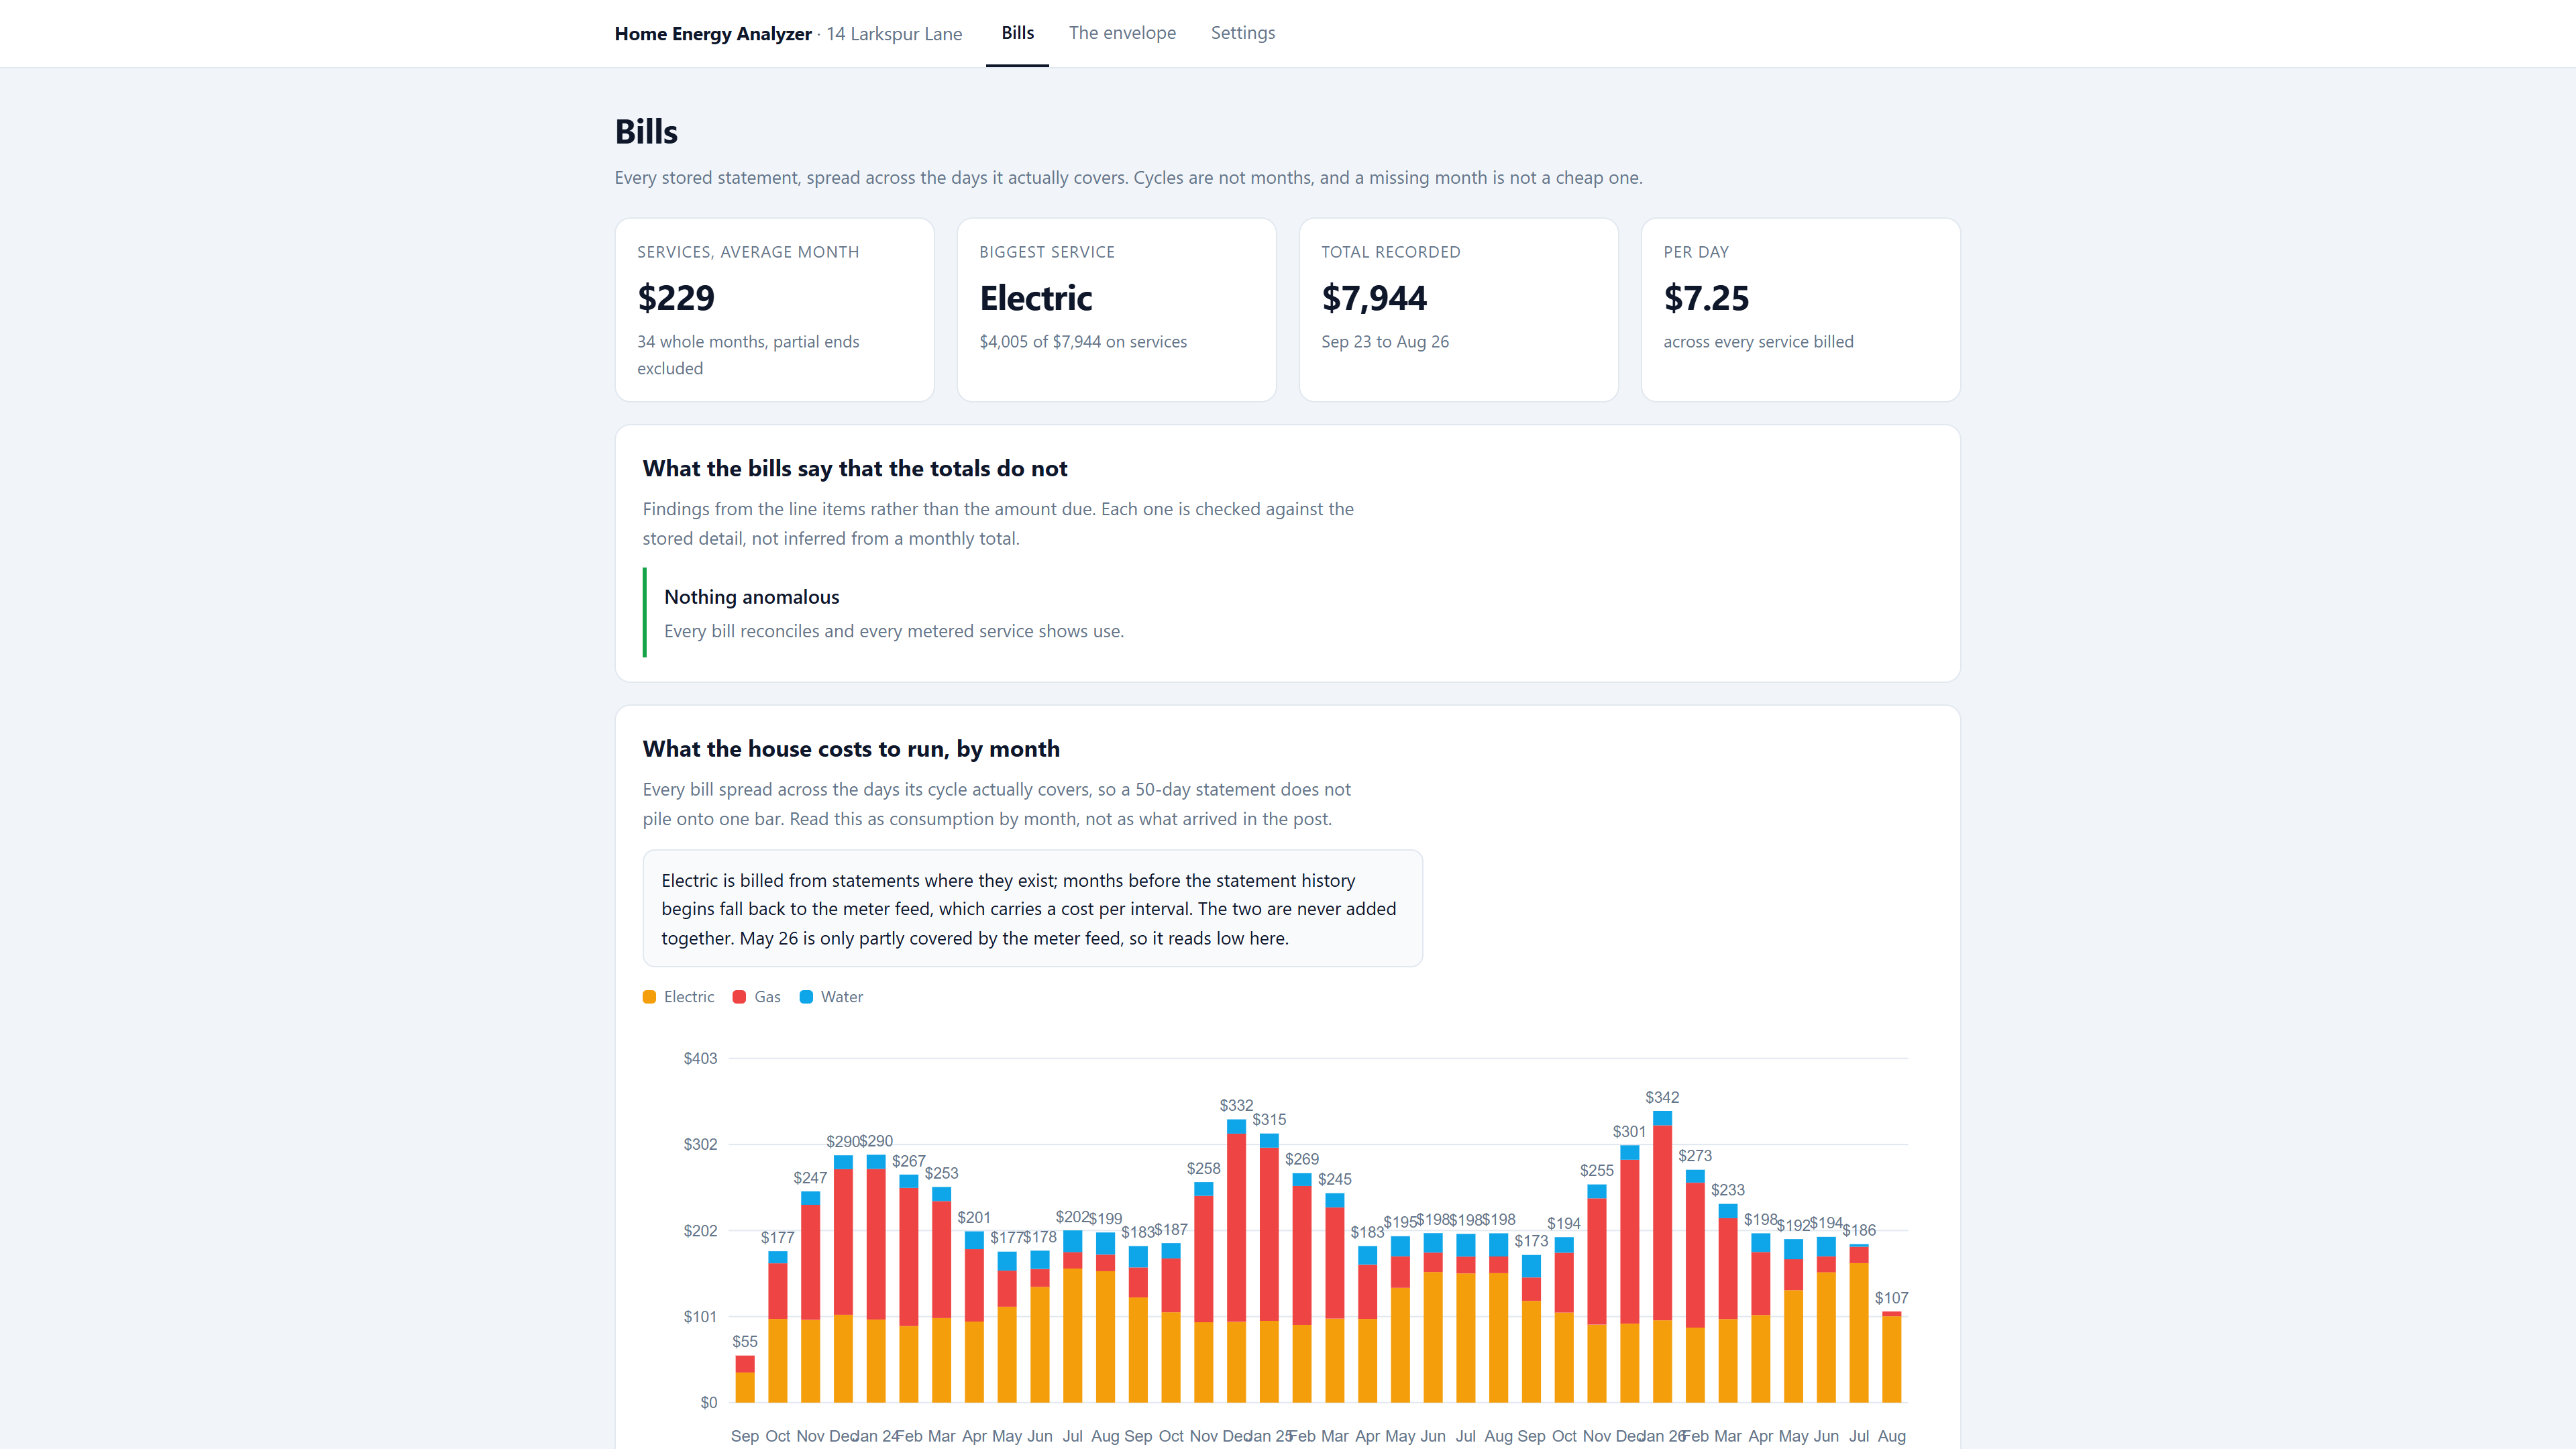
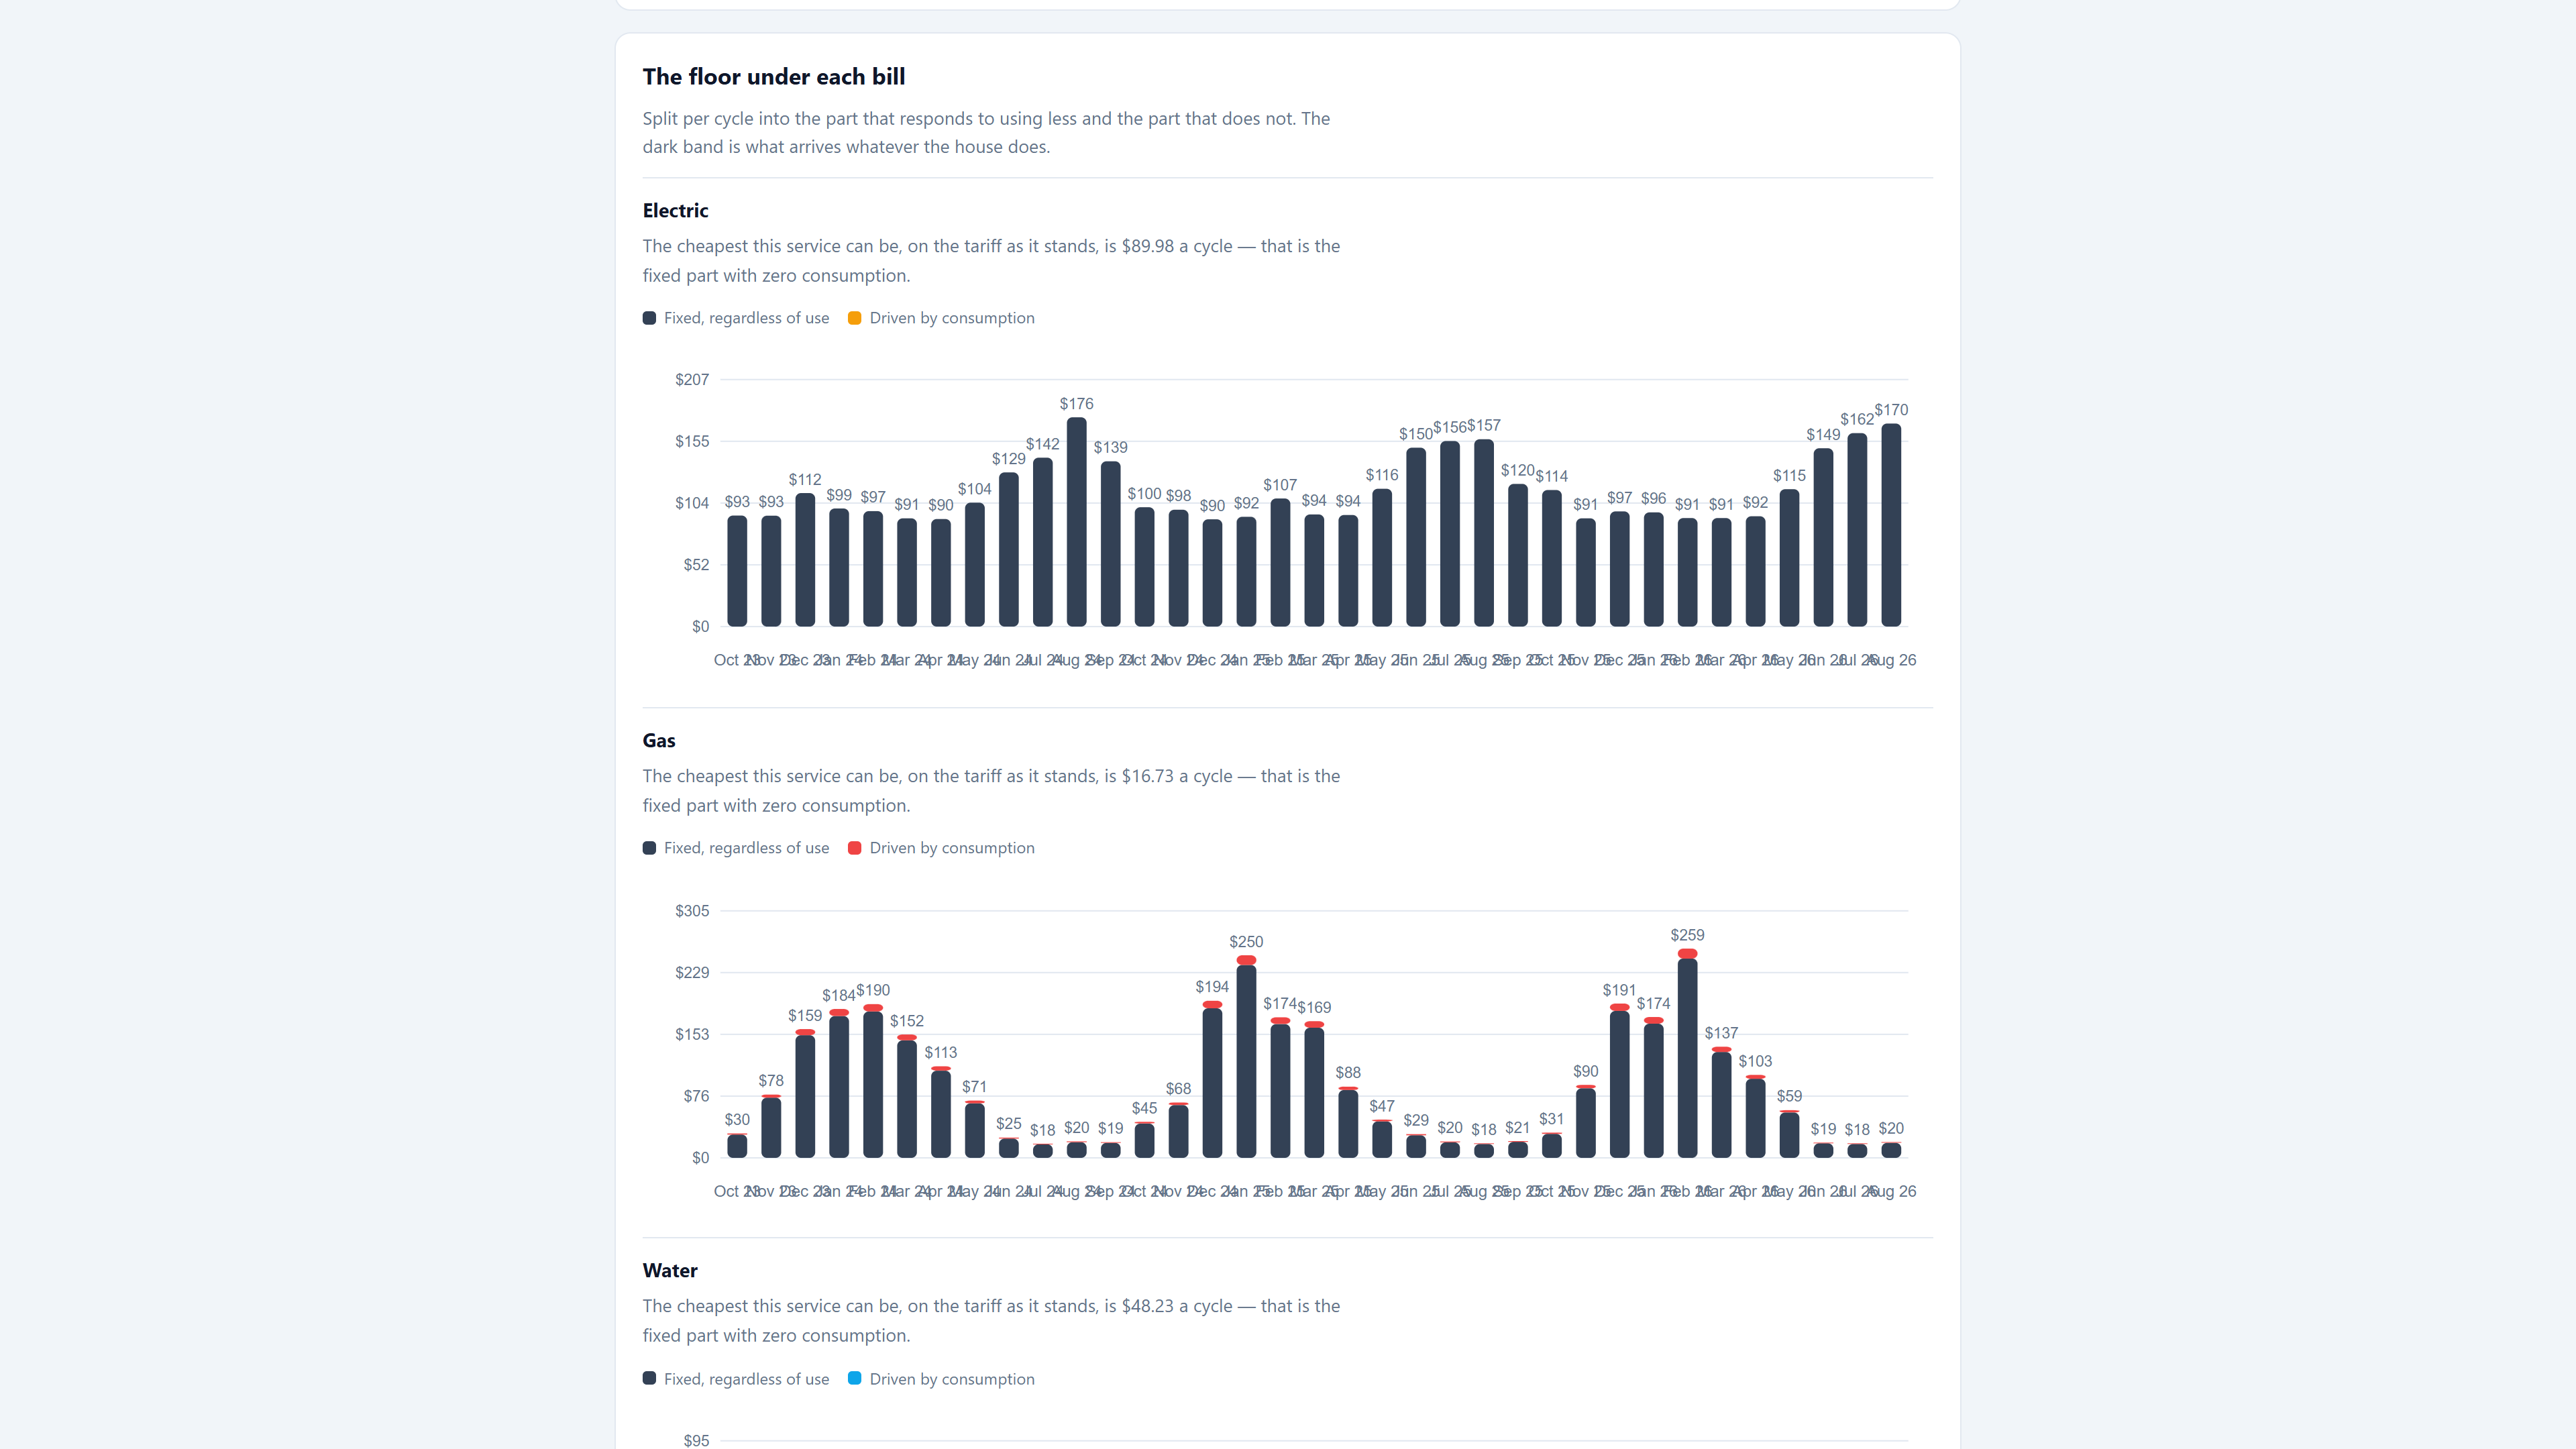
What I ran before shipping it
- 59 tests pass, run out of the exact zip you would download rather than off my working copy.
- I refitted the envelope by hand to check the app's arithmetic: a separate regression over the same 35 billing cycles gives slope 0.16502 and intercept 1.61, which is what it prints.
- Zero JavaScript. No
<script>, noonclick, no listener in any template; no external URL; and norequests,urlliborsocketimport anywhere in the package. - It had a Windows timezone bug, now fixed. Windows ships no IANA database, so every zone quietly fell back to UTC and filed interval readings under the wrong local hour.
Not included
- The headline anomaly detectors cannot be demonstrated. The seeded demo house is clean, so the findings panel prints “Nothing anomalous”, and the dead-meter and late-fee detectors have no test covering them. You would be buying those on a reading of the code, not on a demonstration.
- No utility login, no API, no scraping, no PDF bill parsing. You import CSV or Green Button files you download yourself.
- UA is a range because furnace efficiency is unmeasured, and the field EER is a lower bound — latent load is invisible to cooling degree days.
- It refuses to fit below
MIN_CYCLES = 6. No sensors, no thermostat, no solar, no equipment-sizing verdict, no multi-house, no mobile app, no support. thermal.pyis 625 lines with 13 tests and is not wired to any page — the web layer computes its own fits.- Not an energy audit, and it performs no safety function.
Get it
Home Energy Analyzer — $9
Complete Flask source, 7,480 lines of application Python. SQLite or Postgres, a synthetic demo house so it is populated on first run, and no credentials anywhere.